Many of ITEM’s RFI™ Investigators have performed research using RFI™ in a variety of studies. The study presented below was performed by Jane Oelke, Ph.D. for completion of the Energy Medicine Analyst certification (Step 3 of the Professional Development Series). This report is presented to both illustrate the types of projects one can conduct to earn certification in ITEM’s Professional Development Series, and to demonstrate the usefulness of RFI™ for documenting changes in a subject’s energy fields. In the future we plan to offer a comprehensive listing of RFI™ research studies and topics on this site.
The Effects of Relaxation as Measured by Resonant Field Imaging™ and Heart Rate Variability
Research Project for Innovation Technologies and Energy Medicine (ITEM)
By Jane Oelke, Ph.D.
This research study uses the Resonant Field Imaging (RFI™) system combined with the HeartMath Institute’s Freeze-Framer biofeedback program to show the effects of stress reduction practice on physiological state.
Purpose
Long-term stresses have a detrimental effect on the physical, mental and emotional bodies. When people learn to take relaxation breaks, built-up stress levels can be reduced. As stress is reduced, the nervous system works more coherently, and as a whole health is more easily maintained. With physical coherence, the two branches of the nervous systems are more balanced, creating synchronization between the heart and the brain, affecting all subsystems of the body. Another name for coherence or synchronization is entrainment. Shifts in entrainment levels reflect the coherence of the physiological autonomic nervous system.
This study measured the heart rate variability and recorded the changes in resonant frequencies at seven areas around the head and heart chakra. As the heart rate variability pattern reduces, the nervous system becomes more balanced and less stressed, and the coherence and entrainment increases. Participants in this study practiced their own relaxation techniques, and the results were recorded both in entrainment ratios and resonant frequency shifts. The results were expected to show that as entrainment ratios went up, the RFI™ frequencies would become more focused.
Equipment
The Freeze-Framer pulse measurement and software program measures the heart rate variability and plots graphs and charts during data analysis. The Freeze-Framer has been developed by the HeartMath Institute to monitor the physiological changes during stress reduction exercises. Freeze-Frame is a stress reduction exercise that uses the heart to bring the body, mind and emotions into balance. The research participants will be instructed to breathe focusing on their heart during the 6-minute session.
The RFI™ system, developed by ITEM, employs a hand-held frequency meter with a specially tuned antenna that measures the frequency in Megahertz around the body at various points and distances. It gives a true, real-time reading of the aura frequencies in the natural state at the point of testing. Each frequency can be correlated to one of 15 colors on a frequency chart to assist in looking at Aura colors. The computer software program that accompanies the RFI™ system takes entered frequencies, prints a color chart of the Aura colors on two levels and chakras, and then prints a complete printout of the meaning of the color in the specific areas.
Features of Measurement Devices
Heart rate variability, as measured by the HeartMath Freeze-Framer device, helps measure mental and emotional balance. The heartbeat rate or pulse is constantly varying. Heart rate variability graphs show the rate of changes in the pulse. The changes are influenced by almost any stimulus to the brain or mind, including emotions, thoughts, sound, light, touch, etc. Doctors use heart rate variability to measure the balance between the sympathetic and parasympathetic nervous system. This is due to the two-way communication between the heart and the brain that regulates heart rate and blood pressure. Entrainment ratio shows the coherence of the nervous system to work efficiently or “in sync.” Balance occurs when entrainment levels are in the medium to higher range.
The Entrainment Ratio Bar Chart (Figure 1) is a section of the Freeze-Framer screen that represents the continuously updated graph of the physiological entrainment ratio and heart rate reading during the session. Every five seconds the data is updated in relation to the shifts in the heart rhythm. As the data is recorded, the software program takes the ratio of the averages and adjusts the scores to low entrainment, medium entrainment, or high entrainment. The total of the low, medium and high entrainment scores will always equal 100 percent. The entrainment ratios reflect the average levels of entrainment over the entire length of the ongoing session. The heart rate number displays the average heart rate for last 5-seconds of data. When the session ends, the Entrainment Ratio Bar Chart displays the average entrainment ratio and average heart rate for the entire session.
RFI™ measures the resonant frequencies of the areas around the body. In this study the six points around the head area, plus the heart chakra, were recorded, first before, and again after, the stress reduction exercise. A shift in the resonant frequencies demonstrate the change in coherence in the physiological body related to the shift in patterns in the cerebral area. The readings taken by the meter do fluctuate, yet in most cases the fluctuation is minimal, and within a small range of numbers. Since the energetic body is a vital living system, the fluctuations are expected. Every reading that is displayed on the frequency meter is a correct reading, so for this study the readings that were most common for each point was recorded.
The regular use of the RFI™ system correlates colors to the frequencies found around the body. During this study the colors of the frequencies were not a factor, except to the participants who received a color chart and color frequencies of the seven points for their own personal information.
The six points around the head, as shown in Figure 2 below, represent the cerebral area, or the predominant thought area. During the stress reduction exercise, the thought pattern shifts and upon retesting the new frequencies are recorded in the same sequence as before the stress reduction. The first three points relate to the physical head area, while points 4, 5 and 6 relate to the psychological, or mental and emotional body. The physical points are measured 0 to 4 inches from the body, while the psychological points are measured 4 to 18 inches from the body. The heart chakra point was also included since the Heart Math Freeze-Framer program uses the heart energy as its major focus. The seven charkas in the energetic body relate to specific glands of the endocrine system. The heart chakra point is located at number 7 (Figure 2) and was tested at 4 to 8 inches away from the body.
Figure 2 – Points Measured by RFI™
Research Methods
In this study the percentages of the initial and final entrainment ratios were recorded as a measure of the shift in the lower, middle and high entrainment levels, and this percentage was used to correlate to the shift in resonant frequencies measured before and after in the cerebral area. A total of 82 people participated in this study. Each subject was attached to the Freeze-Framer pulse testing on the right index finger. During the first minute of testing, 6 points around the head and the area over the heart chakra were tested. The first reading of the entrainment ratio was recorded and then the RFI™ practitioner left the client to relax or meditate for 5 minutes. As soon as the tester returned, the entrainment ratio was recorded again, and the 7 points around the body were recorded using the RFI™ system. The client received a sheet indicating the color of their points before and after, and the recording of the change in the entrainment ratio.
Data Analysis
Data from all 82 participants was used. The data generated in this study is presented in an Excel spreadsheet, and is available by clicking here. The readings were compared “Before” relaxation and “After” relaxation. The initial and final entrainment levels were recorded as low, medium and high.
To measure the shifts in entrainment levels, a factor was multiplied to the three levels. This was done to give more value to the higher entrainment ratios. The low entrainment level was multiplied by a factor of one, the medium entrainment level was multiplied by a factor of two, and the high entrainment level was multiplied by a factor of three. By giving more value to the high entrainment level as an indicator of a deeper relaxation state, the shifts in data could be compared. For an example of this factoring the ending data shown in Figure 1 would be read as: 60 x 1 for low entrainment, plus 37 x 2 for medium entrainment, plus 4 x 3 for high entrainment. This equals 146. If the beginning entrainment level was 100% low entrainment, then the entrainment ratio difference would be 46.
The difference between the initial and final RFI™ readings were compared, along with the averages and standard deviations. Additional comparisons were made looking at averages and standard deviation of the data for entrainment ratio factors over 75, which would indicate more major shifts in stress reduction. This comparison was done to evaluate whether participants who were able to go into a more coherent state during relaxation would have similar RFI™ frequencies around their cerebral area.
The participants were told to relax or meditate for the 5-minute session, with the suggestion to breathe while focusing on the heart area. Since emotions have an effect, along with mental thought patterns, the changes in the RFI™ frequency readings can shift depending on the state of mind of the participant. Also with practitioner involvement, like leaving and returning after the 5-minute session, the resonant frequency readings were most likely affected. These factors have not been addressed during this research study.
Results
The data show differences in averages and standard deviation of the seven points before and after relaxation. It also compares differences for those participants who had an entrainment ratio difference greater than 75.
The most measurable results show that the change in standard deviation of the RFI™ measurements after relaxation was lower than before relaxation. This shows that the aura or resonant frequency becomes more focused during relaxation when the body is more coherent, since the deviation is lower. The average standard deviations for all 82 participants were:
Before relaxation exercise = 51.48 MHz,
After relaxation exercise = 38.48 MHz.
There were 14 participants with an entrainment ratio difference greater than 75. Their average standard deviation was 17.44 MHz, even lower than the overall standard deviation as shown in Figure 3. This lower standard deviation average demonstrates that improved heart rate coherence does bring the RFI™ frequency averages for the cerebral area closer together, creating an even more organized thought patterns.
Conclusion
This research study demonstrated that the standard deviation of the RFI™ frequencies decreased when the body is in a more relaxed state. When the entrainment ratio increases demonstrating that the body is working more coherently, the resonant frequencies around the cerebral area of the head and heart area are also more focused around a similar number. This verifies that the mental thought patterns become more organized.
Many ideas for future studies using this technology came up during this research. These two measurement devices are accurate and objective enough that many correlations can be made using both devices. The HeartMath Institute’s studies have given longer periods relaxation time, which would most likely create additional increases in coherence along with an even more focused resonant frequency.
Bibliography
Freeze Frame – One Minute Stress Management, Doc Childre, HeartMath Institute, Planetary Publications, 1998.
Freeze-Framer User’s Manual, HeartMath Institute, 1999.
Resonant Field Imaging™ – Technician’s Manual for Scientific and Clinical Applications, ITEM, 2003.
The RFI™ system and its components are not intended for the diagnosis, cure, mitigation or treatment of any disease nor any other medical condition, and is not intended to affect the structure or any biological function of the body. RFI™ is strictly an “analysis tool” that can be used to identify psychological and physiological energy-information. This information can then be used in various ways depending on the training and experience of the investigator or practitioner.
1. The 260-page comprehensive technical manual Resonant Field Imaging: Technician’s Manual for Scientific and Clinical Applications, which contains detailed instructions on how to use your Resonant Field Imaging™ system to produce full color images and interpretations of the Aura and the human Brain. This technical manual will teach you everything you need to know about the bioenergy mechanics of Auras, including the scientific proof of Auras, and scientific proof of the effectiveness and validity of RFI™. Even beginners will become experts in bioenergy science. The Technical Manual also includes a special section on Aura interpretations for plants and botanicals. Click here to review the Table of Contents for the Technical Manual.
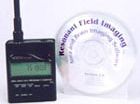 2. A hand-held Digital Frequency Counter, produced by an independent manufacturer of standard scientific equipment. We test and select various devices from different manufacturers, and select the one which is best suited to the RFI™ process, and which gives the best results with maximum flexibility and ease of use. Also, we provide you with a specially-tuned antenna calibrated for use with RFI™.
3. The custom-engineered RFI™ Version 3.0 Computer Software on CD, which includes:
Full Human Body Aura Imaging, which prints full color images and detailed interpretations of the Psychological Level, Health Level, and Chakras of your clients. Click here to view a sample RFI™ Aura & Brain Image Interpretation Report.
Medical quality Brain Mapping, which prints full color images of the brain, and detailed interpretations of right brain bioenergies, left brain bioenergies, and integrated brain bioenergies.
Filing System, which allows you to save and retrieve client data files. This gives you the freedom to reprint a client’s images and interpretations at a later time, and the ability to scientifically document clinical studies of the effectiveness of experimental therapies or medical treatments.
Point / Object Analysis, which allows you to identify the bioenergy in only one region of the Aura, and receive a Psychological or Health level interpretation of the bioenergy color detected in that region. This gives you full freedom to read the human Aura in as much or as little detail as you wish, and the unique ability to identify and analyze the bioenergies of objects, plants, animals, or even paranormal phenomena.
RFI™ Video, created by an existing RFI™ user, which is an excellent marketing tool for presenting RFI™ at public events.
The RFI™ Software requires Windows 98 or higher, 16-bit color capability, a CD-ROM drive, 300 Megabytes of hard drive space, and a color printer. It is designed to run at full capacity even on a portable notebook or laptop computer. Please note that the software is not compatible with Macintosh operating systems. ITEM is in the process of developing software for Macintosh computers – please contact ITEM for current status.
4. 100% White Cotton Lab Coat, which ITEM recommends that you wear during RFI™ sessions to reduce the influence your own Aura may have on your client’s Aura and your measurements. The lab coats come in four sizes: Small, Medium, Large and Extra Large. Please keep in mind that cotton may shrink, so you may want to order a coat that is one size larger than what you may normally wear. The following chart provides the sizes:
| Size | Chest Size (Inches) | Length (Inches) |
| Small | 46 | 37 |
| Medium | 49 | 38 |
| Large | 54 | 39 |
| Extra Large | 57 | 39 |
5. Lifetime License to use this exclusive technology, and all copyrighted materials including the software program, interpretations, imaging charts, and the Technical Manual. Your License is recognized through a Certificate prepared specifically for you.
6. Lifetime Technical Support. We will gladly answer any questions to help you use RFI™ in your health care practice or scientific research laboratory. We regularly process all questions from our Licensed Scientific Investigators, conduct further research to develop the best answers, and mail reports of the results and findings to ALL licensed users of RFI™.
7. Free Listing in ITEM’s Directory of Energy Medicine Professionals for One Year. You can provide us with the details of your specialization, profession, and skills, and we will advertise you and your services for one year free. Your listing can be renewed in subsequent years.

Brain Optimization & Synchronization System™
- revolutionizing the way we think about energy and balance
© 2026 www.item-bioenergy.com. All rights reserved.